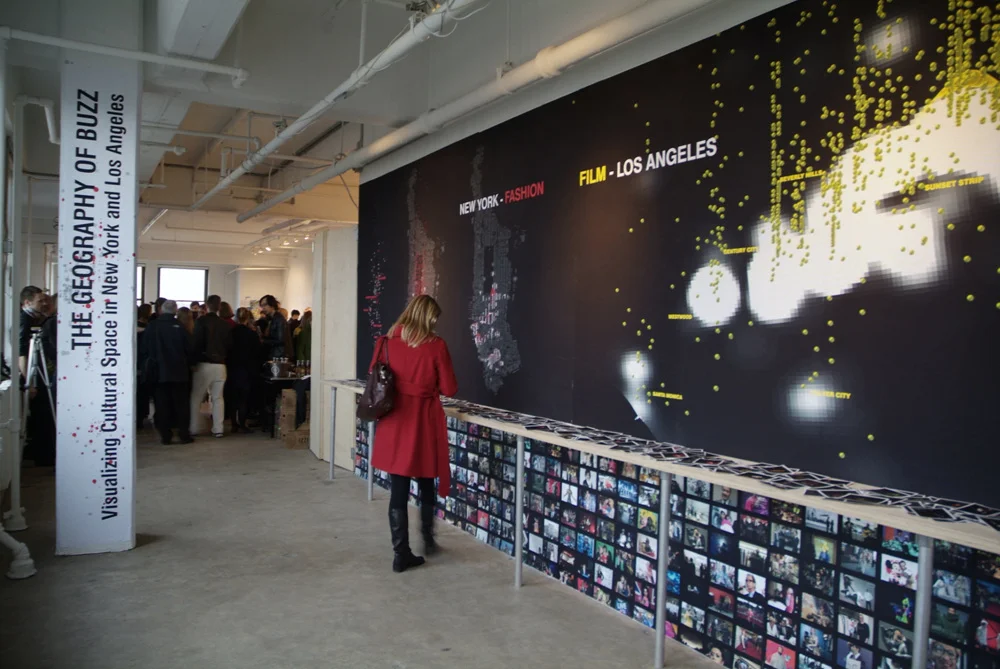
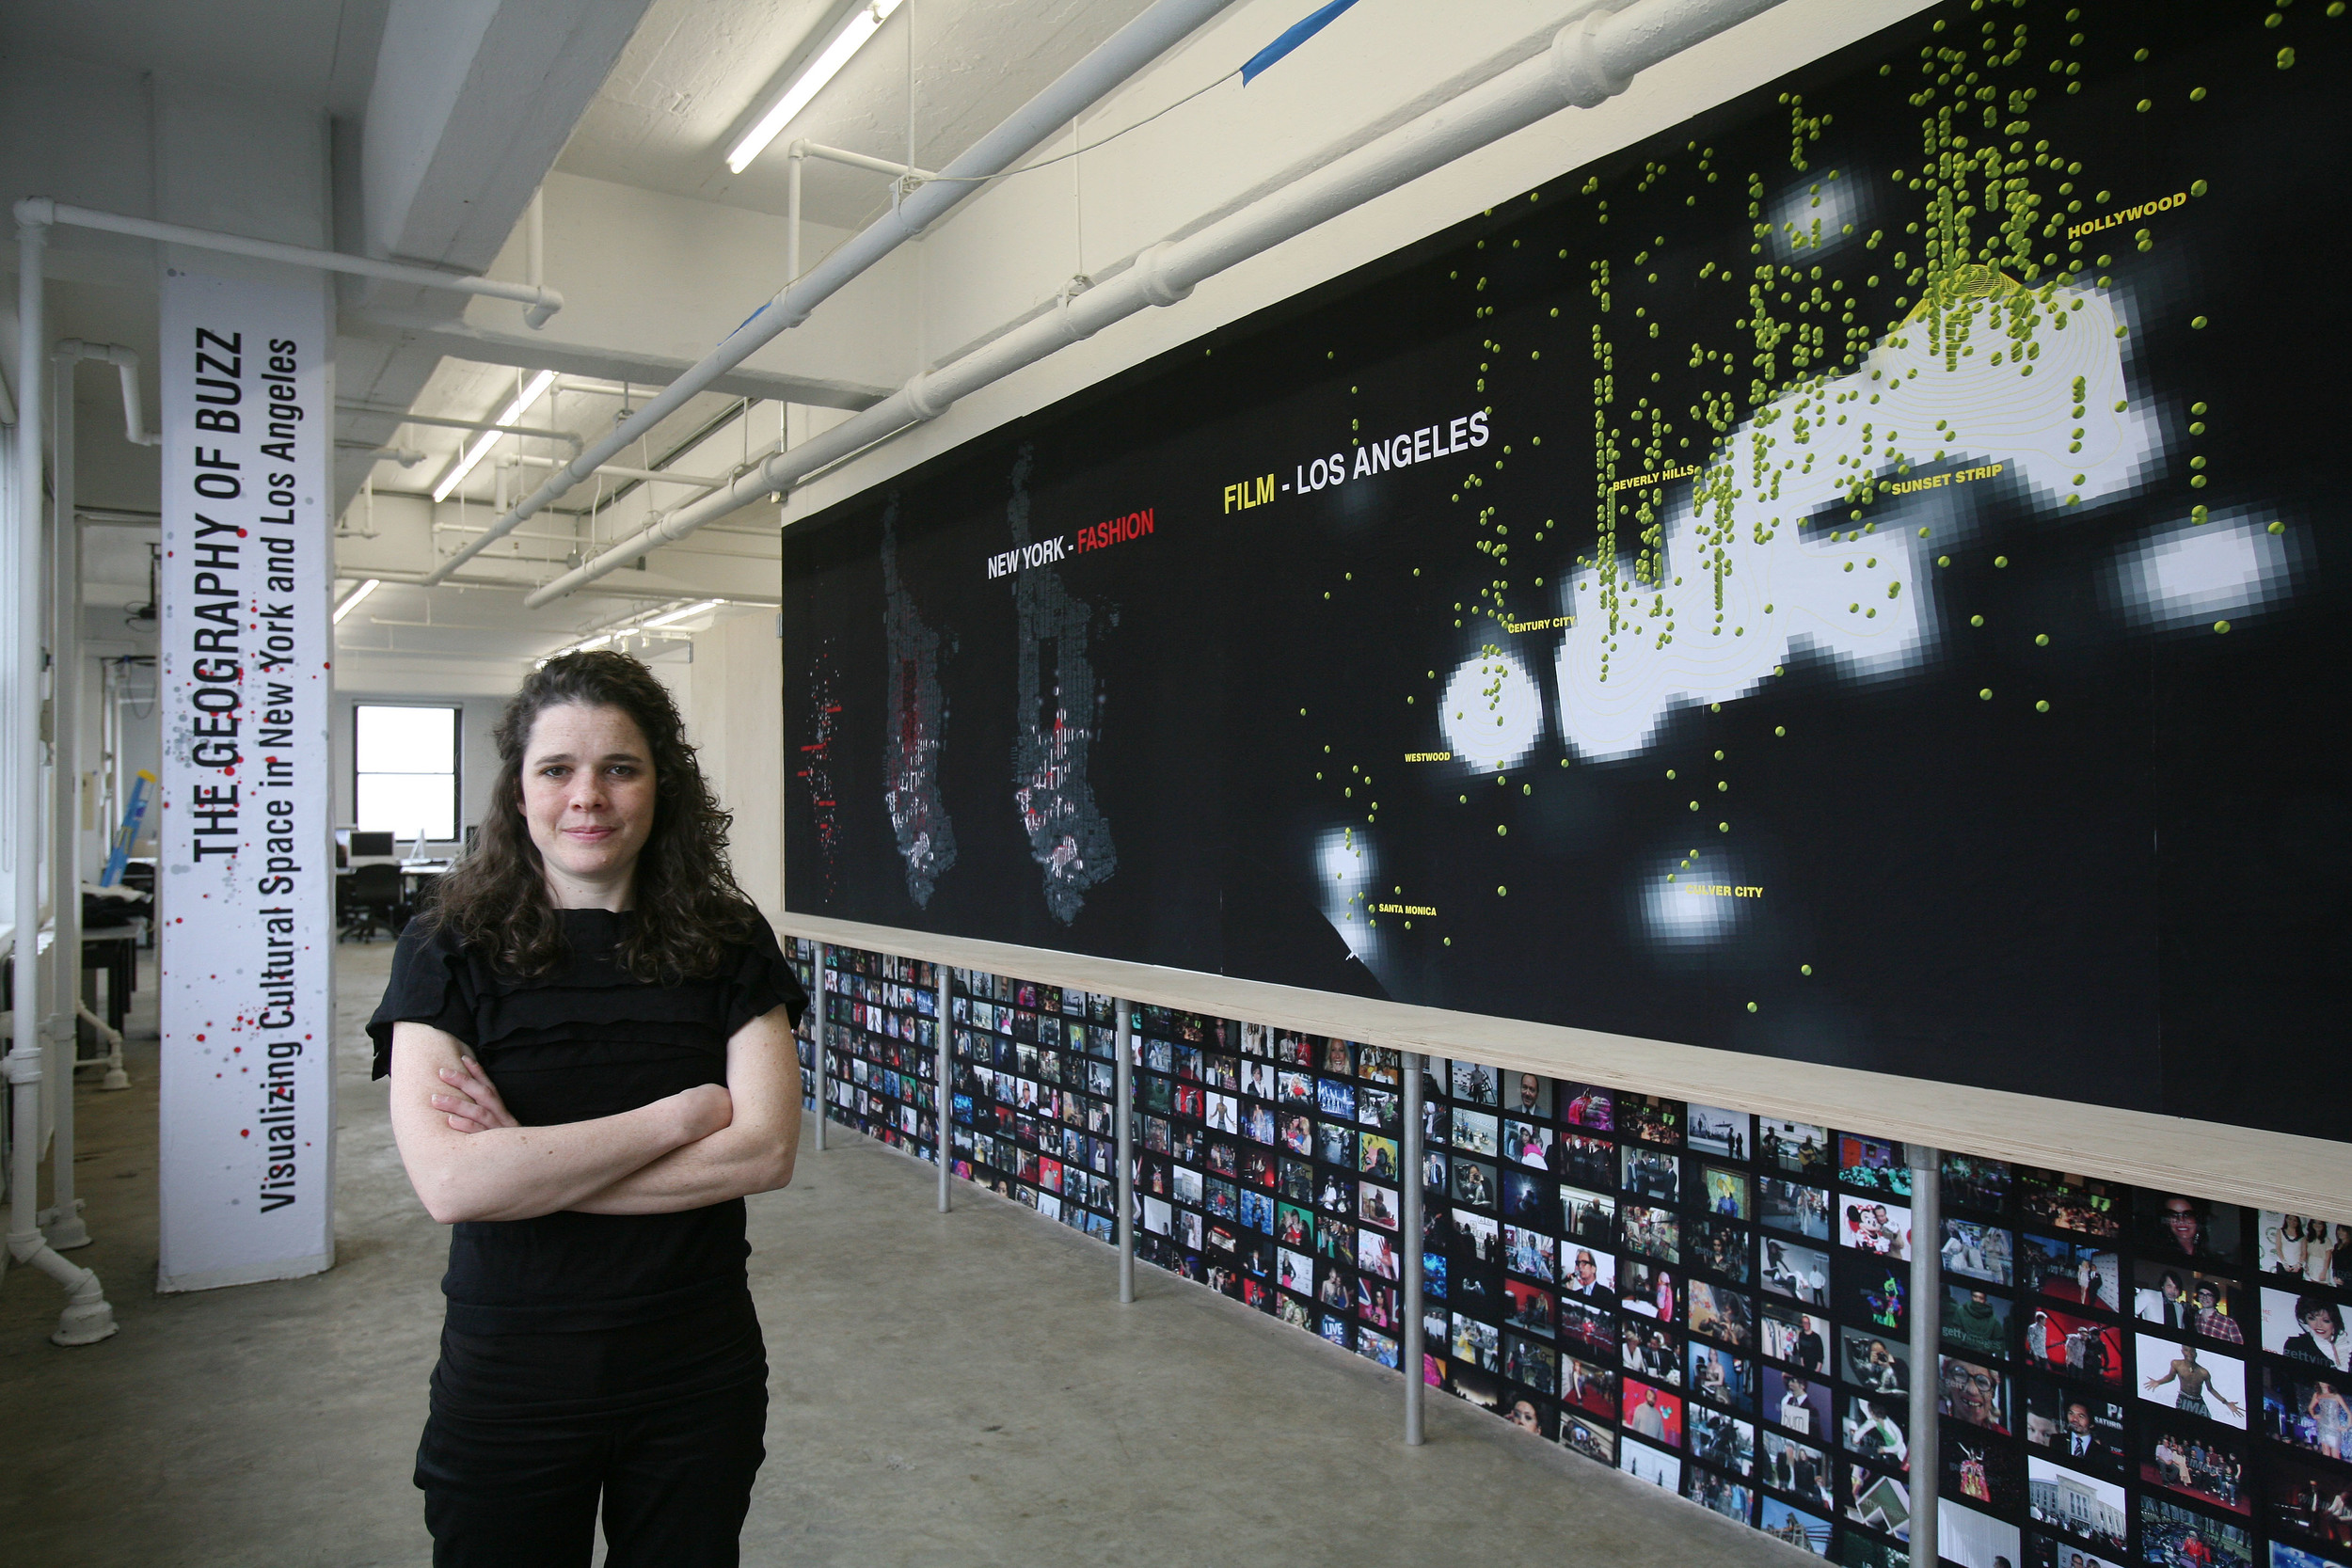

The Geography of Buzz: Visualizing Cultural Space in New York and Los Angeles
Sarah Williams, Minna Ninova, and Elizabeth Currid
Studio-X New York, 2009
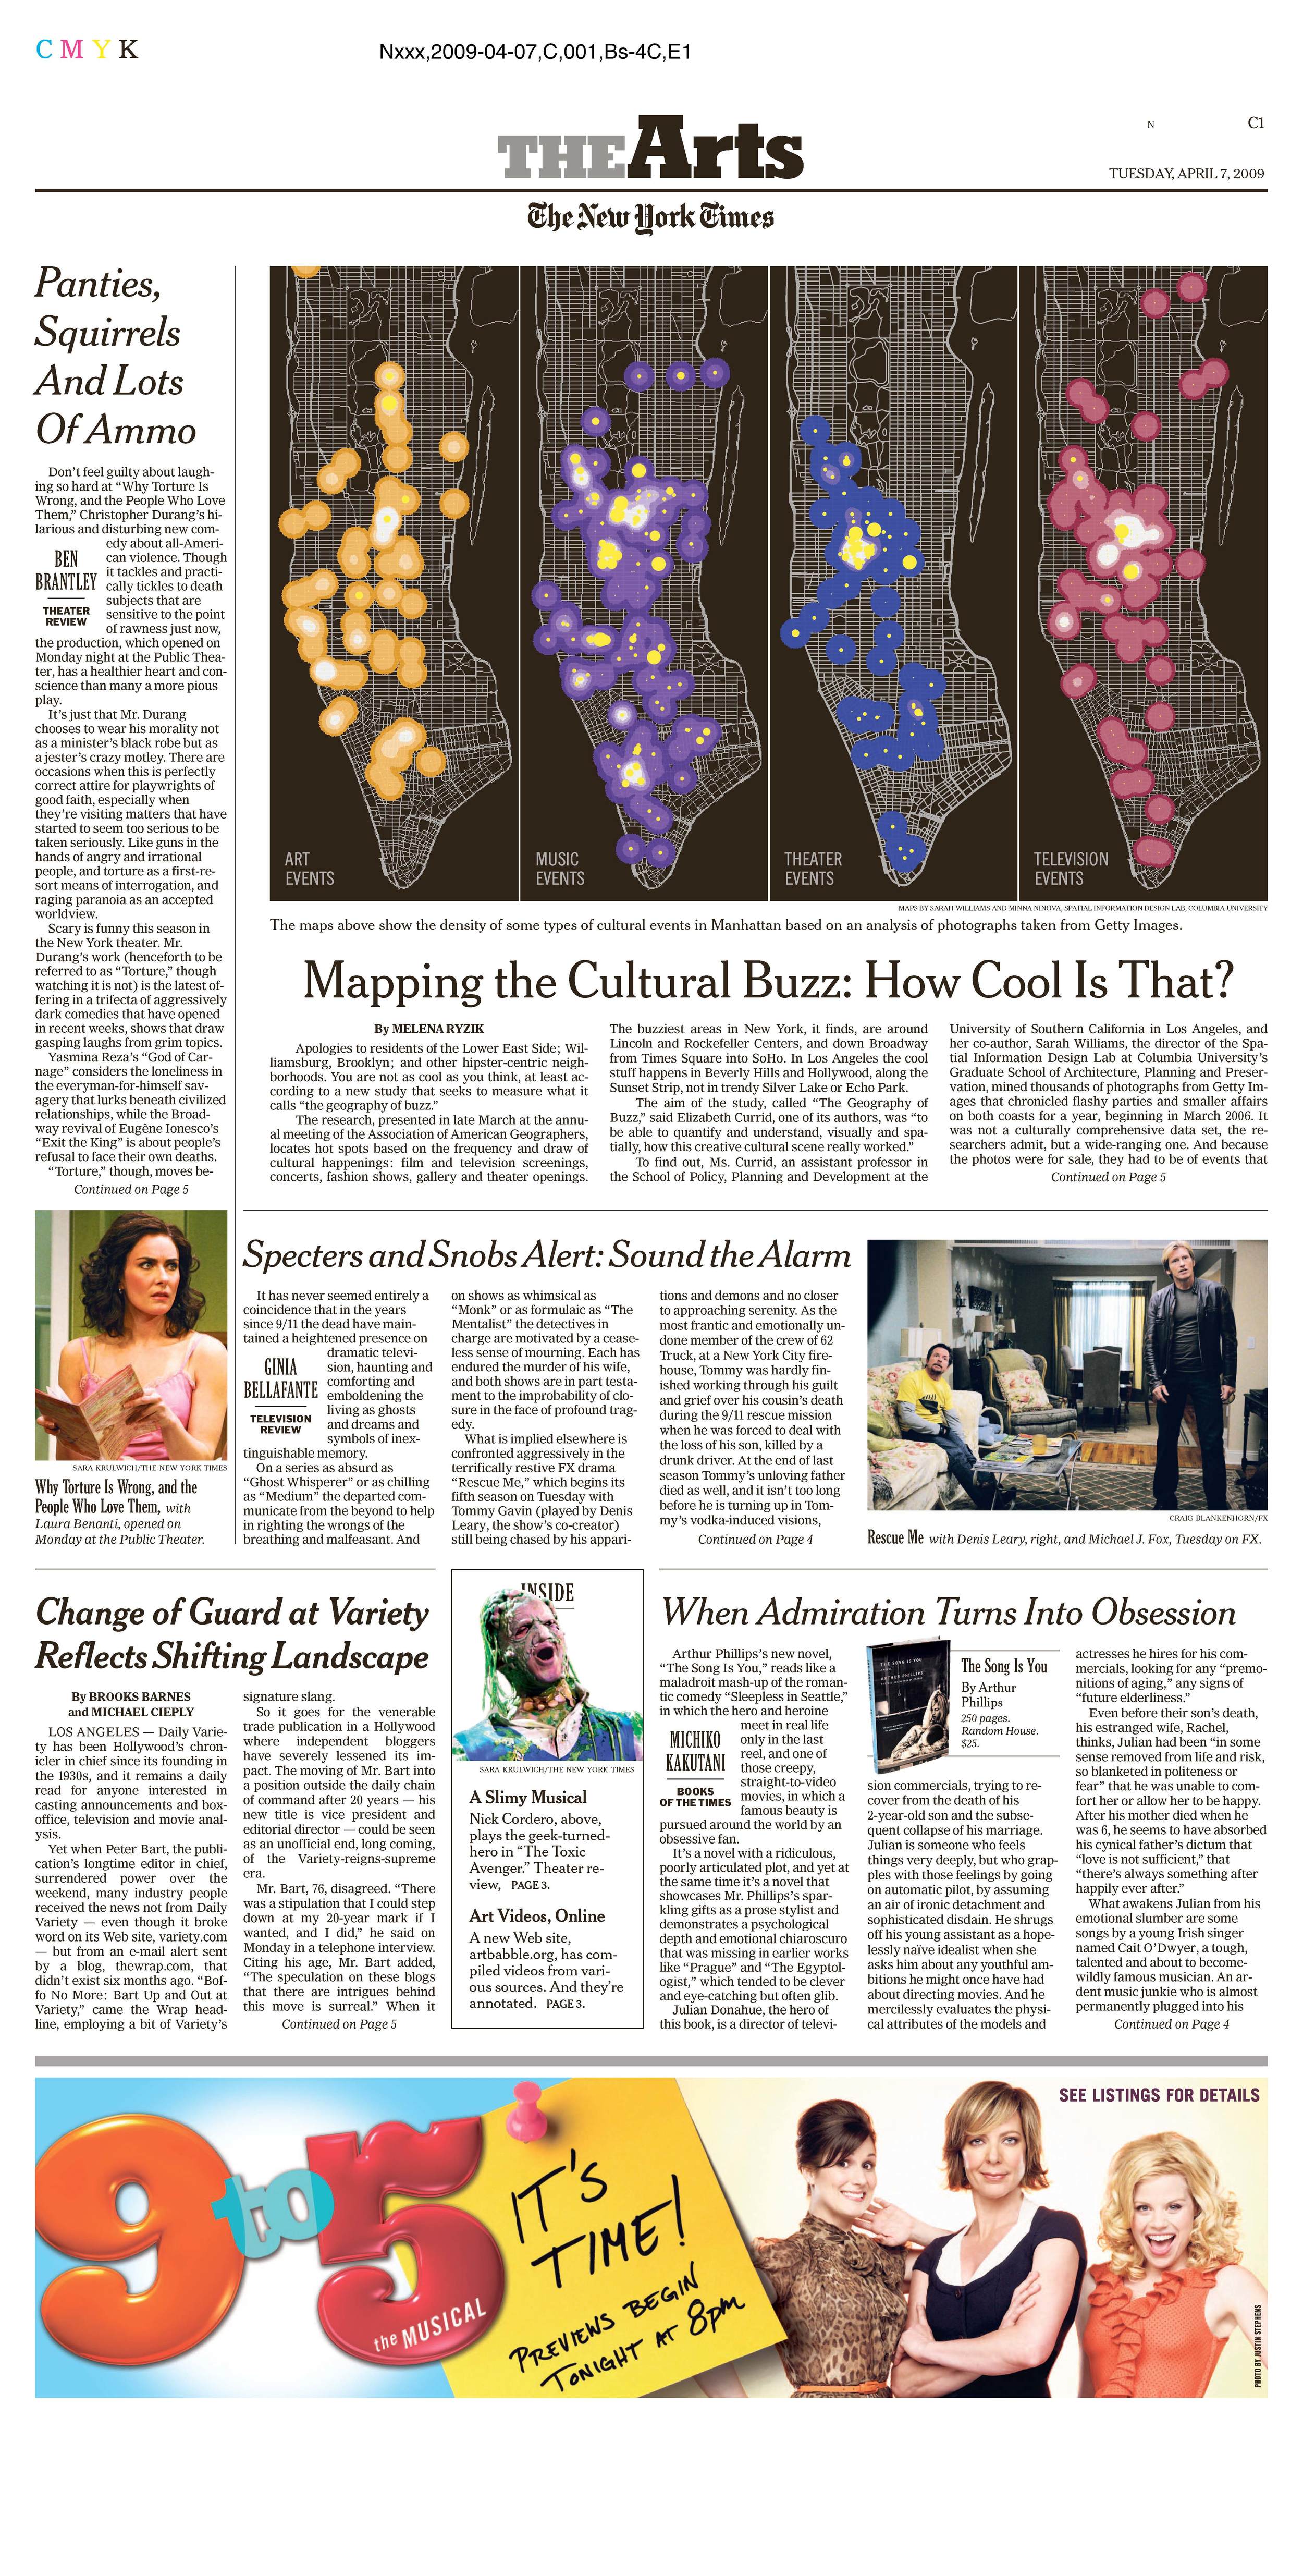
Sarah Williams, Minna Ninova, and Elizabeth Currid took a unique dataset, the Getty Image Database, and transformed it to explain the spatial patterns of cultural industries. By geo-referencing, coding, and performing statistical analysis on 6,000 events and 300,000 photographs taken in New York and Los Angeles, the team has shown that cultural industry events tend to cluster spatially. While the data might illustrate what we already know — that certain “hot spots” in the city exist — investigating them in this way allowed them to gain a better understanding of why clustering occurs in certain localities.
Analysis of the data showed that those actors not conventionally involved in city development (paparazzi, marketers, media) have unintentionally played a significant role in city development. They also argue that the findings on the cultural industries may tell us something important about the geographical form of industrial social clustering more generally. The use of Getty data provides a new spatial dimension through which to understand both cultural industries and city geographical patterns.
Coverage of The Geography of Buzz: